Objectives of the Product
Nowadays, most of the applications that the customers need require high responsiveness capability and extended areas monitoring. These needs can be satisfied by deploying a SAR satellite constellation system with multi-launch capability to optimise both the launch strategy and costs. Therefore, it is key to evolve the present radar technologies to improve both the SAR instrument flexibility, in line with the customers’ request, and its compactness for microsatellite configuration for the constellation purpose. The relevant TAS-I product is the SAR Micro Satellite Constellation (SMSC).
The intention is to develop a micro SAR instrument which implements all the standard operative modes (Stripmap, Spotlight, ScanSAR) to operate on a micro platform; for such reason an advanced and highly flexible digital SAR electronic subsystem section is a key feature. The innovative SAR instrument is conceived with an electronic digital section developed at board level to be compatible with the lightweight microsatellite solution concept, targeting a satellite product for the deployment of constellations with a variable number of satellites.
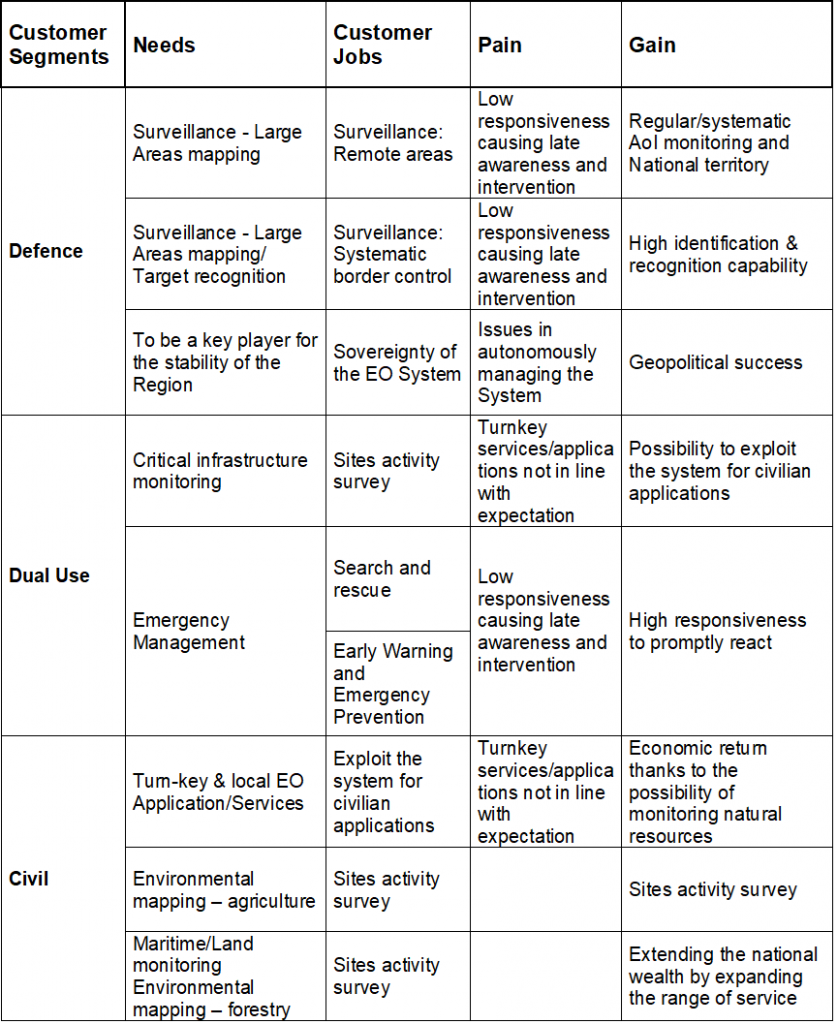
Customers and their Needs
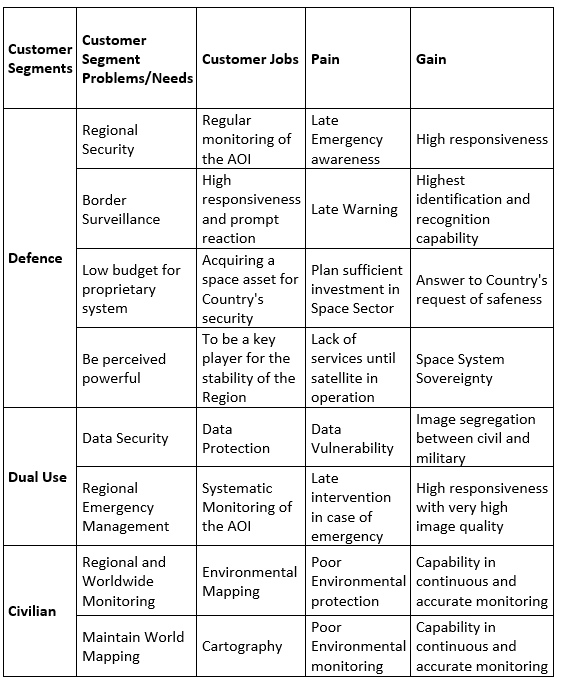
Typical Customer needs are summarised in the following table, highlighting for each ‘need’ the “Pain” and “Gain” offered by the SMSC product.
Targeted customer/users countries
Institutional and commercial entities distributed worldwide which intend to improve their national services and space capabilities.
Product description
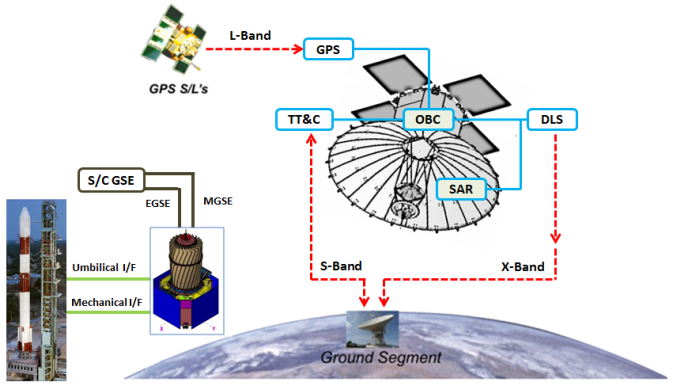
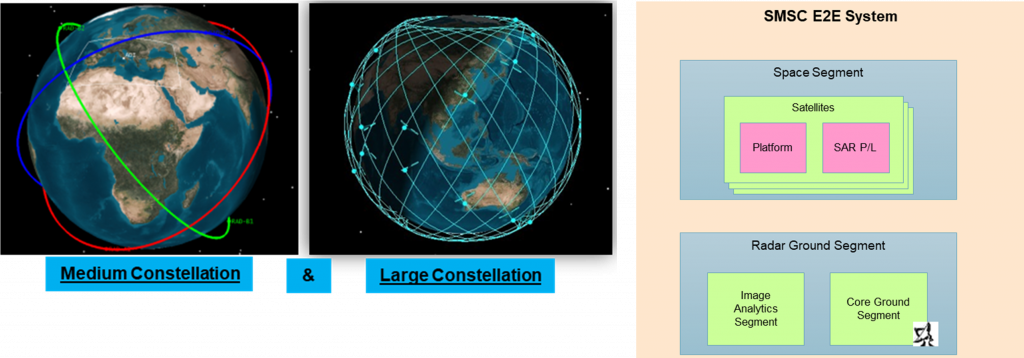
The microDRCE is a key element of the digital section of the SAR electronic subsystem of the SMSC product, an End-to-End Earth Observation System consisting of:
- Space Segment organised in constellation with medium or large number of SAR satellites with a mass <200kg;
- Radar Ground Segment composed of the Core Ground Segment and the Image Analytics Segment.
The key features of the SMSC product are:
- High responsiveness capability;
- Regional or global access capability, able to operate in inclined or Sun-synchronous orbit;
- Satellite architecture optimised for a perfectly suitable product in terms of mass and volume, to be easily deployed in a large constellation;
- Fast orbital replacement thanks to the compatibility with several launchers
- X-band multi-mode SAR Instrument (Spotlight, Stripmap and ScanSAR) based on an active planar phased array antenna relying on an innovative highly integrated architecture.
The SAR Microsatellite constellation product is able to serve at the maximum extent all the emerging Space Services with “quasi real time” applications and high performances.
Added Value
Nowadays, most of the applications that the customers need, require high responsiveness capability and extended areas monitoring. The actual SAR Earth Observation systems mainly rely on high-end systems, that provide high image quality capability with poor temporal performance due to a reduced constellation size.
On the other hand, in the last years, several emerging companies have deployed (or are in the process to deploy) large constellations of SAR microsatellites, providing commercial services which address specific fields of applications but do not cover all the customer needs. The new SMSC product is able to satisfy all the market needs coming from present and potential future customers.
The distinctive features of the SMSC product are:
- High responsiveness capability;
- Regional or global access capability;
- Satellite architecture optimised for multi launch to be easily deployed in a large constellation;
- Fast orbital replacement thanks to the compatibility with several launchers;
- X-band multi-mode SAR Instrument based on an active planar phased array antenna to cover all the customer needs.
Current Status
Kick-Off meeting held on 12 April 2023.
Final Review held on 25 September 2025.
The project succeeded in accomplishing its main objectives of the design, qualification and validation of the advanced and highly flexible digital SAR electronic subsystem section. The microDRCE project gave a major contribution to the development of the SAR Electronics Subsystem of new TAS-I microSAR instrument, and thus the related product.