Objectives of the Product
The STRATOSYST’s HAPS for Earth Observation project has been focusing on aligning our platform with user needs. Through market surveys and user interviews, we identified key requirements such as high-resolution, continuous monitoring, all-weather performance, and real-time data delivery. These insights are shaping our development approach, ensuring that SkyRider meets the demands of the addressed sectors.
A key outcome of this phase is a potential development partnership with a data processing company, where SkyRider’s data processing will be tested in real-world conditions. On the technical front, we’ve finalised the foundations for the Digital Twin and CFD analysis, collaborating with key partners to ensure the platform’s readiness. Moving forward, these learnings and milestones will guide the next phases of SkyRider’s development, keeping user-driven innovation at the core of our efforts.
Customers and their Needs
The target customers for STRATOSYST’s SkyRider HAPS platform include data processing companies, environmental monitoring agencies, disaster management organizations, and industries requiring continuous, high-resolution EO data. These users need real-time, persistent data for applications such as environmental monitoring, disaster response, and resource optimisation.
Existing satellite systems, while useful, often fail to deliver the required high- resolution data and frequent revisit rates, with high costs and temporal limitations. Drones and aircrafts, while alternatives, lack the ability for long-term or remote monitoring.
SkyRider addresses these challenges by providing continuous, flexible, and high- quality data collection. Over 130 potential users were identified, and seven comprehensive interviews were conducted to ensure alignment with customer needs. Key requirements such as all-weather performance, continuous monitoring, and real-time data processing have been integrated into SkyRider’s development. This user-driven approach ensures that the platform meets the specific needs of its target sectors, offering a cost-effective and adaptable solution for the evolving demands of EO customers.
Targeted customer/users countries
The majority of the initial targeted customers for STRATOSYST’s SkyRider HAPS platform are located in Europe and North America. These regions, with their established EO markets and demand for advanced data solutions, are key focus areas for the platform’s early adoption.
Product description
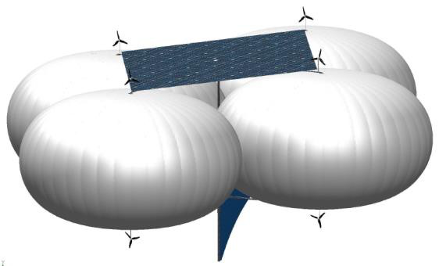
SkyRider HAPS is a Lighter-Than-Air vehicle with a 30 kg payload capacity, designed for year-round stratospheric operations. Unlike space-based platforms, SkyRider operates in the stratosphere, providing imaging data continuously. Its stratospheric segment includes seven key subsystems: buoyancy, structure, propulsion, safety, power, electronics, and communication. Equipped with station- keeping capabilities, SkyRider hovers persistently over any location on Earth, offering uninterrupted service for scientific and commercial applications. Propulsion is powered by solar panels, enabling efficient navigation through stratospheric winds. The ground segment features a mobile discharge ramp, communication antenna, and control system, all compactly stored in a standard ISO container for easy transport.
Added Value
The STRATOSYST’s SkyRider HAPS platform offers distinct advantages over traditional EO methods such as satellites, drones, and aircrafts. Satellites provide broad coverage but are limited by high costs, lower resolution, and infrequent revisit times, making them less suitable for continuous, localized monitoring. Drones and aircrafts offer better resolution but lack the endurance and cost-efficiency needed for long-term or remote operations.
SkyRider addresses these gaps by delivering persistent, high-resolution data over specific areas at lower operational costs and without environmental impact. Operating in the stratosphere, SkyRider enables continuous monitoring with minimal latency, overcoming the limitations of satellites and aircrafts. This makes it ideal for real-time, localised applications like environmental monitoring, disaster response, and secure communications. Additionally, SkyRider integrates seamlessly with the existing EO infrastructure, complementing satellite data by providing higher resolution and reducing latency. Its all-weather capability and extended operational time make it uniquely valuable to sectors that require reliable, high-quality data over-extended periods.
SkyRider thus brings unmatched flexibility and persistence to meet evolving data needs.
Current Status
During the first six months, STRATOSYST focused on customer identification and outreach, conducting over 130 contacts and six detailed interviews to refine the SkyRider HAPS platform. The activity was promoted at international events like Eurosatory and Collision, leading to discussions with potential partners, such as flight planning or data processing companies. Additionally, STRATOSYST introduced the HAPS for EO solution to commerce diplomats from wildfire-prone countries.
Negotiations with key companies are ongoing. The next steps include formalising business opportunities based on customer insights and preparing for a following design and development phase.