Ellipsis Map Engine

Objectives of the Product

Existing tabular compute engines are not built for raster data.

The problem is that existing compute engines force users to manually catalogue, shard, and mosaic their raster data for distributed compute and integration. This slows down spatial data science, making professionals lose weeks to manual data preparation and awkward workarounds, instead of gaining insights and scaling capabilities.

As a solution, Ellipsis Map Engine brings users map-native, distributed analysis to all their geospatial data types so they can run their workflows instantly, without the manual work. It’s the missing piece, the fit-for-purpose raster data Lakehouse that brings users fast and easy spatial data science at scale:

  • Automate raster data ingestion, management and distribution
  • Run scalable, flexible and interactive spatial analytics effortlessly
  • Get insights across GIS & non-GIS systems instantly

Customers and their Needs

The targeted user segments are Space/EO-powered value-adders, Civil Engineering – environmental (hazard), water and/or geotechnical engineering and consulting -, and P&C/Ag. insurance (insurance, reinsurance, GIS/NatCat data and/or consulting services). 

Because the state of the art in performant geospatial data analytics currently lacks the possibility to create raster-native frameworks, the existing table-native engines are unable to automatically ingest and spatially shard raster data, leaving the job of catalogue building, sharding and mosaicking to the end user. This is a major handicap for our target customer segments (all professionals who rely on EO/spatial data and who want to use and integrate this into data science workflows, either for internal use or to provide better/new services to clients). The lack of infrastructure that supports such interactive data science on raster data is increasingly painful because EO and environmental data (commonly found in raster format) are increasingly relevant due to climate change and environmental risks that are affecting the industries of our target customers.

End users (representing each of the target segments) are involved in the activity as pilot users and will provide us with feedback and validation throughout the project.


Targeted customer/users countries

Committed pilot users are confirmed for The Netherlands and France. Our target segments have a global presence and Ellipsis Map Engine, as an infrastructure solution, is not geographically limited.


Product description

Under this activity, we are building the Ellipsis Map Engine. This product complements existing table engines by uniquely allowing users to load any EO and spatial data into a cluster, and have each node automatically host a section of the dataset based on geography (spatial sharding). So, when a Python command is created, it can be run both rapidly and geospatially aware, as each node in the cluster only needs to execute the command for the geographic section it has loaded. This simple but effective strategy supports use cases in which ever changing spatial logic needs to be applied to large raster/spatial data on-the-fly.

Our team’s existing product, Ellipsis Drive, is a central repository for discovering, managing and consuming spatial data across teams, organisations and workflows. Clients pay a monthly/quarterly/yearly fee to use Ellipsis Drive to search, access and leverage their EO/spatial datasets as high performance and interoperable web services (storage-based PaaS model). The Ellipsis Map Engine is an extension to this existing solution, adding the option to apply flexible and high-performance analytics to the spatial data that customers are hosting (adding a fee for use of Processing Units under the same Paas model).


Added Value

Users can automatically run arbitrary logic on any EO/spatial data in a distributed and spatially aware way and use results in both GIS and non-GIS systems instantaneously. This unique capability allows them to get answers to ad hoc spatial analysis challenges easily and time efficiently, just like they are used to when analysing table-native data with regular tabular engines. Thus, this tool creates value for Data Scientists, Actuaries and Geo Engineers who work with EO and EO-derived (raster) data, allowing these professionals to apply complex – and ever changing – analytics to spatial/EO data in a highly time-efficient way.

For Data Scientists, consultants, and actuaries in P&C/Ag. (re)insurance, this directly supports highly effective pricing, (aggregate) risk mapping, portfolio management and claims operations (all processes relying on EO/raster data and ad hoc spatial logic).

For Data Scientists, Consultants and (Geo)Engineers in civil engineering this means getting the answers to their client’s questions much more quickly and accurately, including for governments, environmental agencies as well as energy and utility companies. For Data Scientists and Consultants working at EO value-adding companies, providing flexible and ad hoc EO-powered data services is much easier and more cost efficient.


Current Status

The activity has just kicked off. The project team is working to deliver on its first milestone, currently conducting market research for requirement definition and prioritisation, creating and fine-tuning the pricing model, and building fitting B2B go-to-market alliances and channel partnerships. Soon we will also start with technical storage and compute design, product development and the creation of detailed user stories.

FANTOM

Objectives of the Product

FANTOM supports the Department for Environment, Food & Rural Affairs ambition “to make our air purer, our water cleaner, our land greener and our food more sustainable. Our mission is to restore and enhance the environment for the next generation, and to leave the environment in a better state than we found it.”

FANTOM builds a high spatial and temporal resolution UK-centric database of agriculture and biodiversity markers with deep thematic content and context to support schemes aimed at the UK’s Agricultural Transition as well as supporting Net Zero and climate change activities.

These markers, schemes and impact assessment layers will be available to all government agencies, associated arms-length bodies, and commercial companies to be able to monitor and measure the progress of their sustainability activities and interventions.

Initially focused on delivering markers to support schemes for agricultural Paying Agencies, the aim is to ensure that the markers and schemes have a wider commercial need across government, non-government and commercial markets.

Furthermore, it will change the current perception of Earth observation-based land monitoring that not only looks at the asset but also its relationship with neighbouring assets to support landscape-level sustainability activities across the wider landowning community.


Customers and their Needs

FANTOM’s primary intended customers are agricultural Paying Agencies in the United Kingdom and the European Union.

First, these organisations deal with a huge number of landowners and require ongoing information on their customer base. This assessment demands automated and reliable satellite data analytics to ensure that subsidies and interventions are made correctly and can be monitored.

Second, there are a wide range of users interested in monitoring their land to evaluate its habitat quality and biodiversity value. This includes Paying Agencies but also other government bodies such as Environmental Ministries plus commercial actors such as developers, infrastructure owners and more. These users face the challenge of understanding the impact of their actions on the wider landscape.


Targeted customer/users countries

UK, EU


Product description

FANTOM delivers high spatial and temporal resolution markers to support agri-environmental schemes through the analysis of EO data and its integration with ancillary information.

The main subsystems and components of FANTOM are:

1. Data Ingestion and storage: handled primarily by Earth-i’s existing satellite and in situ data processing workflow with necessary customisation for FANTOM.

2. Data Processing:

Depending on the marker requirements:

  • Processing scripts capture the workflow and procedures to be applied to the data to realise the markers and evaluations;
  • An AI toolset provides the facility to analyse imagery using tools such as computer vision, machine learning and neural networks;
  • Scheme scripts will combine information about multiple markers to perform scheme assessments.

3. Data Analysis: analytics performed using a combination of sophisticated computer vision techniques and machine learning models to pick out specific identifiable features in the source satellite data. Outputs the markers required for the individual scheme assessments.

4. QA/QC Pipelines: QA/QC pipelines allow both manual and automated intervention.

5. Data visualisation: using existing platforms and open-source tools, visualisation will allow the user to overlay the resulting markers on the map, chart the outcomes and make rapid statistical assessments of marker outcomes and scheme results.


Added Value

FANTOM will reduce the amount of time that it would otherwise take Paying Agencies to generate a full and comprehensive set of monitoring indicators for the new Environmental Land Monitoring approach being rolled out across the UK as the successor to the EU Common Agricultural Policy. This means they will be able to monitor compliance and effectiveness of new policies right from the outset. The data products themselves represent value in the form of the customised, rigorously tested algorithms developed and implemented, along with a robust quality control regime, providing data that can be relied upon and can be verified with physical observations in the field. The markers and scheme assessment outputs scale reliably to address the Impact Potential, Technical Feasibility and Financial Viability of the monitoring.

FANTOM can promote the integration of ecological knowledge about the landscape into a data product, and model the change of the Habitat Quality and Biodiversity Potential so that customers can consider how a scheme is influencing changes over time and integrate this into policy development.


Current Status

The FANTOM project kicked off in March 2025. The first phase of the project is focused on consolidating the requirements baseline through workshops with key end users and stakeholders. The workshops explore the technical, performance, timeliness, quality and product format requirements.

HABTRAIL

Objectives of the Product

HABTRAIL addresses the challenges posed by Harmful Algal Blooms (HABs), which impact aquaculture, public health, tourism, and insurance sectors. HABs contaminate seafood, disrupt aquaculture operations, cause economic losses, and pose risks to human health. Traditional monitoring methods rely on costly, time-consuming water sampling and lab tests, often leading to delayed responses.

HABTRAIL provides an AI-driven early warning system that accurately predicts HAB occurrences and bivalve toxicity up to three days in advance. The platform integrates satellite and in situ data with advanced machine-learning models to deliver real-time insights.

Users access the predictions through a web dashboard, where they can visualise HAB severity, receive species-specific interdiction forecasts, and configure personalised alerts. Aquaculture operators can optimise harvesting schedules, public health offices can make informed safety decisions, and tourism and insurance entities can manage risks proactively.

By offering predictive analytics and automated alerts, HABTRAIL shifts HAB management from reactive to proactive, reducing financial losses, improving food safety, and ensuring sustainable marine resource use. The platform’s expansion will enhance its accuracy, cover more geographic regions, and incorporate additional environmental factors to support decision-making and regulatory compliance further.


Customers and their Needs

HABTRAIL targets aquaculture entities, national regulatory bodies, public health offices, tourism businesses, and insurance companies. These customers face significant challenges due to Harmful Algal Blooms (HABs), which disrupt operations, endanger public health, and cause economic losses.

  • Aquaculture entities (fish and bivalve farms) rely on HABTRAIL’s predictive insights to minimise losses by adjusting harvesting schedules and ensuring seafood safety. Their challenge lies in obtaining timely, cost-effective, and reliable data to mitigate production risks.
  • National regulatory bodies oversee seafood safety and environmental monitoring. They need accurate, real-time data to issue interdictions and ensure compliance, but current monitoring methods are reactive, costly, and slow.
  • Public health offices must prevent foodborne illnesses from toxic seafood. They require predictive tools to safeguard consumers and optimise response measures.
  • Tourism businesses (beach operators, tour agencies) suffer from reduced visitor numbers when HABs affect water quality. They need timely forecasts to adjust plans and avoid reputational damage.
  • Insurance companies rely on environmental risk assessments to price policies and process claims. A lack of reliable historical data makes risk evaluation difficult.

HABTRAIL directly involves these stakeholders by providing an AI-powered web dashboard with real-time predictions, automated alerts, and risk assessments, enabling data-driven decisions to mitigate the impact of HABs.


Targeted customer/users countries

HABTRAIL initially targets Portugal for deployment, focusing on its coastline and estuarine zones. Expansion is planned for Spain, France, and Italy in Europe (Year 2), followed by the USA and Chile in the Americas (Year 3), and later Japan and South Korea in Asia (Year 4-5). These countries have significant aquaculture industries, regulatory bodies for marine monitoring, and coastal tourism sectors affected by Harmful Algal Blooms (HABs).


Product description

HABTRAIL is an AI-powered web-based platform that predicts, monitors, and issues early warnings for Harmful Algal Blooms (HABs). It integrates satellite data with machine learning models to forecast HAB severity and bivalve toxicity with over 90% accuracy for the next three days. Users interact with the platform through a web dashboard, where they can visualise HAB severity maps, access species-specific interdiction forecasts, and configure custom alerts via email or SMS.

Innovative Aspects
  • AI-Driven Predictions: Unlike traditional reactive monitoring methods, HABTRAIL uses deep learning to analyse satellite imagery and identify patterns in HAB development.
  • Multi-Algorithmic Approach: Combines clustering, pixel segmentation, and deep neural networks to improve detection accuracy and reduce false positives.
  • User-Friendly Interface: Provides real-time, interactive dashboards tailored for aquaculture operators, regulatory bodies, public health officials, and insurers.
  • Scalability & Regional Adaptation: The model is designed to expand to new coastal areas with minimal additional data collection.
User Interaction
  • Aquaculture entities optimise harvesting schedules and reduce economic losses.
  • Regulators receive interdiction forecasts and cross-validate decisions.
  • Tourism and insurance entities monitor risk levels to adjust policies and business operations.

By shifting from a reactive to a proactive approach, HABTRAIL ensures safer, more sustainable management of marine resources.


Added Value

HABTRAIL brings significant added value compared to traditional monitoring methods and existing competitors by offering a proactive, AI-driven approach to Harmful Algal Bloom (HAB) prediction.

Key Differentiators
  1. AI & Multi-Algorithmic Analysis – Unlike competitors that rely on threshold-based methods, HABTRAIL uses deep learning to detect patterns in satellite imagery, reducing false positives and increasing predictive accuracy.
  2. Real-Time & Predictive Alerts – While current monitoring systems rely on costly, delayed lab testing, HABTRAIL delivers three-day advance forecasts, allowing aquaculture businesses and regulators to act before contamination occurs.
  3. User-Centric Dashboard & Automation – Unlike government-provided raw data portals, HABTRAIL offers a visual, user-friendly dashboard with customisable alerts, making it accessible to non-experts.
  4. Regional Adaptability & Scalability – Many existing solutions are site-specific or limited to post-event analysis. HABTRAIL’s AI models are scalable and adaptable to new coastal areas without requiring extensive new data collection.
  5. Comprehensive Stakeholder Support – Unlike competitors that focus solely on aquaculture or research, HABTRAIL supports national regulators, public health, tourism, and insurance sectors, integrating multiple industry needs into one solution.

By transitioning from a reactive to proactive strategy, HABTRAIL minimises financial losses, improves food safety, and enhances environmental protection better than any existing alternative


Current Status

HABTRAIL is in an advanced development phase, with key achievements including the successful implementation of AI-driven predictive models, achieving over 90% accuracy in forecasting HAB severity and bivalve toxicity. A functional web dashboard has been developed, providing real-time data visualisation and customisable alerts.

Current work focuses on expanding geographic coverage from the initial L7C2 (Algarve) test zone to the entire Portuguese coastline, refining species-specific interdiction forecasts, and enhancing model precision using additional environmental data.

Upcoming activities include user onboarding for aquaculture entities and national regulators, gathering feedback for system optimisation, and integrating new features such as pixel-based HAB, SST, and CHLOR_A predictions. Future expansion plans target Spain, France, and Italy in the next phase. The project is progressing on schedule, with ongoing validation efforts ensuring operational readiness for commercial deployment.

HySpex MSC

Objectives of the Product

The Methane Satellite Camera (MSC) from HySpex addresses the urgent need for accurate and cost-effective monitoring of methane emissions. Methane is a highly potent greenhouse gas, and is the second greatest contributor to global warming, only second to carbon dioxide. To limit emissions of methane, upcoming regulations demand effective emission tracking. By optimising our camera for satellite use, we will provide a reliable solution for industries to identify and reduce methane leaks at large scales, contributing to global efforts to mitigate climate change.

HySpex MSC allows for rapid deployment of methane detection capabilities as it aims to be a space-proven commercial-of-the-shelf solution, building upon our decades-long experience building hyperspectral cameras.


Customers and their Needs

Target customers for HySpex MSC are Earth Observation (EO) satellite service providers within the energy and environmental sector that operate their own satellites and constellations.

Currently, if a satellite service provider wants to offer methane detection as part of their services, their only option is to design and build their own instrument capable of detecting methane. This is a complex task requiring substantial financial investments over several years, involving multiple stages of critical research, development, and testing. The process carries a high level of risk, with no guarantees that the system will work. Such development typically falls outside the core competencies of these companies, and they would prefer to avoid such high-risk projects. Our HySpex MSC provides a cost-effective, ready-to-use solution that eliminates the need for service providers to develop such custom instruments, thereby reducing both financial risk and time to market.


Targeted customer/users countries

Global, but with specific focus on Europe and the US, who implement strict methane regulations.


Product description

HySpex MSC is a near-commercial off-the-shelf (COTS) instrument designed for methane detection from satellite platforms. Within the broader system and service ecosystem of its target users, HySpex MSC enables customers to launch and operate satellites capable of delivering high-resolution methane emission maps over large areas. This empowers end-users with actionable data for monitoring and mitigating methane emissions.

HySpex MSC incorporates our proven proprietary designs to achieve its mission. At its core it is a cutting-edge spectrograph design, integrated with a newly developed telescope and a diffraction grating optimised specifically for methane detection. Together, these components form a highly stable push-broom camera architecture.

Key performance highlights include:

  • Ground Sampling Distance (GSD): 60 meters
  • Spectral Sampling: < 2.5 nm in the spectral range of 1340–2500 nm
  • Signal-to-Noise Ratio (SNR): Optimised for precise methane detection

This innovative combination delivers unparalleled accuracy and reliability in methane mapping, while providing a scalable, efficient solution for satellite missions.

Preliminary overview of the HySpex MSC

Added Value

HySpex MSC is the first commercially available, off-the-shelf (COTS) hyperspectral camera capable of detecting methane from space. This innovative instrument empowers less integrated Earth Observation (EO) service providers to access methane monitoring capabilities without the need for complex in-house development.

Currently, providers without such access face an overwhelming challenge: building their own methane detection payload. This process demands substantial financial resources, years of research and development, rigorous testing, and carries significant risks, with no assurance of success. HySpex MSC eliminates these barriers by offering a ready-to-deploy, low-risk alternative.

By bridging this gap in the EO value chain, HySpex MSC accelerates the adoption of methane monitoring globally. This directly supports efforts to combat climate change by enabling broader and faster deployment of EO services for methane tracking.

HySpex MSC’s streamlined approach significantly reduces costs, risks, and time-to-market, delivering unparalleled value over in-house development while fostering innovation across the EO industry.


Current Status

Building upon the existing SWIR640 camera, HySpex MSC leverages HySpex proven spectrograph design, allowing for a short development cycle of only 12 months. Optical design and mechanical design of the new camera is well underway and will be completed early in the first quarter of 2025.

terrAIntel

Objectives of the Product

terrAIntel addresses the key challenges faced by non-technical users, particularly in the field of journalism. These challenges include technical barriers to accessing EO data products, limited interpretability without specialised expertise, processing delays that hinder timely reporting, and a lack of transparency in data sources and methodologies.

To overcome these obstacles, terrAIntel integrates Natural Language Processing (NLP) capabilities, allowing users to pose geospatial questions in natural language and receive intuitive, data-driven responses. This innovation has developed a demonstrator that transforms dense, complex EO data products into actionable insights, empowering non-expert users to confidently utilise EO data products for fact-based reporting, environmental monitoring, and urban development while minimising on-ground risks.

Key features include a user-friendly dashboard for data visualisation, customisable fields of interest, and metadata transparency to foster trust in the insights provided. terrAIntel streamlines the entire EO data product lifecycle by accessing diverse datasets and delivering tailored, comprehensible outputs for demonstration. This approach not only simplifies data interpretation but also promotes sustainability through improved data reusability.


Customers and their Needs

terrAIntel primarily serves non-experts, especially journalists, seeking intuitive access to EO data products. Key users include digital and investigative journalists, data storytellers, and, in the future, corporate users in fields like urban planning, disaster management, and environmental monitoring. These users often lack the technical skills to navigate complex EO data products or interpret outputs effectively.

By enabling users to ask geospatial questions in natural language and providing actionable insights through visualisations like maps and graphs with transparent metadata, terrAIntel addresses challenges of accessibility, interpretability, and timeliness. This allows users to make informed decisions without requiring specialised training. Feedback and pilot testing from journalists and media organisations ensure the platform meets their needs for accurate reporting and storytelling.


Targeted customer/users countries

The targeted customers and users of terrAIntel are global, with early adopters based in Austria, South Africa, and North America. These hubs serve as hubs for extensive networks of data journalists focused on digital media. The platform’s scalability and broad applicability ensure accessibility to global markets, supporting diverse industries while advancing the vision of expanding EO data usage among everyday users.


Product description

terrAIntel provides an intuitive, user-friendly interface powered by Natural Language Processing (NLP), allowing users to query EO data in natural language. What sets terrAIntel apart is its ability to grant access to EO data products and transform complex datasets into actionable intelligence through automated interpretation, complemented by visualisations such as maps and graphs.

This approach reduces the need for prior training and makes data interpretation more accessible, significantly enhancing the usability of EO data across industries. Key features include customisable fields of interest, real-time data access, and transparent metadata, fostering trust and ensuring accuracy.

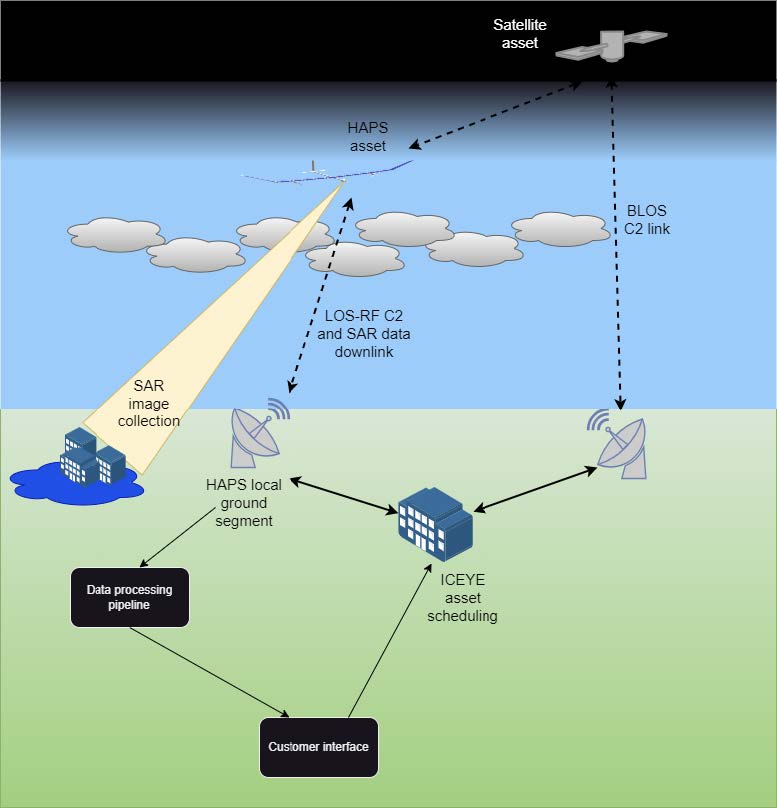
Preliminary HAPS stratospheric segment design

Added Value

The EO industry faces a significant challenge with an overwhelming influx of data that is difficult to manage, access, and reuse effectively. This often results in EO data products being created as one-off outputs and subsequently forgotten. terrAIntel addresses this problem by enabling a broader range of users to interact with EO data without requiring extensive prior training. By improving accessibility and usability, terrAIntel empowers non-experts to derive meaningful insights, expanding the industry’s user base and promoting long-term data sustainability.

What distinguishes terrAIntel from competitors is its dual focus on both accessibility and interpretability of EO data products. While many solutions emphasise data access, terrAIntel goes further by helping users fully understand and utilise EO data. Through Natural Language Processing (NLP), automated interpretation, intuitive visualisations, and interactive queries, terrAIntel transforms complex datasets into actionable outputs, reducing reliance on specialised expertise and making EO data approachable to a wider audience.


Current Status

The terrAIntel project officially started with the Kick-Off Meeting on 9 December 2024. Upcoming priorities include gathering user requirements and refining the technical objectives in preparation for the Requirements Review milestone.

Skyfora’s Tropospheric Satellite

Objectives of the Product

National weather services and private weather companies can get many-fold more data than today from each weather balloon launch. These data contribute to more accurate weather forecasts.

This Tropospheric Satellite measures wind (including gusts and turbulence), standard pressure, temperature, and humidity variables. The main added feature is Airborne Radio Occultation, giving on average about 10 extra sensor-grade vertical profiles of temperature, humidity and pressure. As extra variables, it also measures infrared, visible light and UV-B radiation, and, optionally, air quality. The tropospheric satellite is standardly sold as a hardware product.

We also sell higher-level processed meteorological data. As a particular feature, AI and data fusion algorithms are being developed during the project. Data are processed with machine learning-based data fusion from other weather data sources, notably EO satellite data, to give more accurate weather data than what it is accomplished with Airborne Radio Occultation alone.


Customers and their Needs

The solution serves both public and private sectors, targeting national weather services (including storm measurement operators and climate/weather researchers), as well private weather instrument companies. The fundamental value proposition is simple: obtaining more upper-air weather data at very little extra cost.
In other words, meeting the urgent demand for filling important upper-air data gaps by using infrastructure and weather balloons that would be launched anyway. This leads to better weather forecasts and multiple societal benefits.


Targeted customer/users countries

The solution will be piloted with customers from Europe and USA.


Product description

The main building blocks are:

  • the StreamSonde radiosonde/dropsonde
  • an embedded GNSS receiver
  • a Ground Segment for telemetry and data processing
  • a Tropospheric Satellite Data Processing module, whose most important part is the radio occultation engine
  • an AI engine doing data fusion of tropospheric satellite and space-based satellite EO data.

The role of the Tropospheric Satellite, in the context of the overall system of its target users, is as part of a weather observation network, typically comprising a diverse suite of different instruments. The main new feature developed for the hardware is the ARO capability from the existing GNSS receiver.

The dual-band GNSS antenna (dipole) used in the StreamSonde/Tropospheric Satellite is excellent for ARO from weather balloons, as the main lobe of the antenna has a maximum in the horizontal directions, capturing low-elevation signals with maximum signal-to-noise ratio. Typical tilt angles for the Tropospheric Satellite attached to the balloon with a string are +/- 30 degrees during ascent. These angles are still within the main lobe of the antenna (antenna gain 0 to 1.72 dBi).


Added Value

With our solution, it is possible to obtain more upper-air weather data at very little extra cost. RO profiles from LEO satellites are worth at least €5 per profile. The ‘remotely sensed profiles’ are worth clearly less per profile than actual radiosonde profiles, but when adding all the extra profiles up, we get at a minimum of about €50 in commercial benefits for essentially the same radiosonde unit costs after an initial R&D investment. Typical studies also show that €1 invested into weather technology is returned to €5-7 of societal benefits, making the overall societal value greater than the commercial sales value.

By optimising the balloon, the Tropospheric Satellite can float for longer periods of time, even up to several days, further multiplying the benefits. Longer-living stratospheric or high tropospheric balloons may multiply the factor.

Moreover, as the Tropospheric Satellite’s data is processed with state-of-the-art GNSS processing algorithms and AI and data fusion methods, the accuracy and fraction of high-quality data will improve. Using advanced pattern recognition algorithms, refractivity profiles can be intelligently decomposed to their temperature, pressure and water vapor constituents, in a more precise way when using external EO data, and deeper into the troposphere than is currently possible.


Current Status

The activity was launched in December 2024 with user requirements’ collection and an initial system architecture design deriving from the user requirements. This will be followed by the launch of the developed work, providing beta versions of the different subcomponents of the product. At the end of the 10-month de-risking phase, the subcomponents and the full system will be tested prior to the next actual product development phase.

VALUESAFE

Objectives of the Product

VALUESAFE fills an important gap for companies and public institutions responsible for buildings and properties by helping them understand the risks their assets face from natural disasters. Foreseeing how much an earthquake, flood, or landslide could impact these properties financially can be challenging.

VALUESAFE changes this by using satellite data, maps, and digital images to evaluate the risks buildings face based on their location and structure. Through a simple online platform, users can request custom risk assessments and receive detailed reports that estimate possible damage and loss in value. This data helps them make informed decisions about insurance, maintenance, and disaster preparedness, ultimately protecting their assets. By combining many data sources, VALUESAFE’s unique algorithm aims to provide consistent, accurate predictions on risk and economic impact, offering a faster and more efficient alternative to traditional inspections.


Customers and their Needs

VALUESAFE is designed for public and private groups responsible for managing and protecting different building stocks, including cultural heritage sites. Private clients, like insurance companies and asset managers, need reliable, science-based risk data to guide business strategies and reduce unexpected losses., Meanwhile, public agencies can use VALUESAFE’s insights to prioritise mitigation actions, allocate resources, and plan safer communities. Both groups struggle with finding affordable, accurate risk evaluations that don’t require time-consuming, costly site visits. VALUESAFE’s online platform addresses these needs by offering tailored, easy-to-understand reports and a straightforward interface. This setup allows users to access vital risk information and connect directly with experts, helping them focus on long-term planning and resilience while saving time and resources.


Targeted customer/users countries

Italy and Europe.


Product description

VALUESAFE provides an online portal that enables users to access services, customise risk assessment requests, and manage outputs related to property vulnerabilities against natural disasters like earthquakes, floods, and landslides. The platform generates detailed analyses of potential damage and expected depreciation of buildings. To achieve this, VALUESAFE integrates three core evaluations:

  • Vulnerability assessment: analysing building characteristics that influence risk levels by employing digital and satellite imagery.
  • Hazard assessment: utilising recognised maps and satellite data to determine the probability and intensity of events.
  • Exposure evaluation, which measures the number of people, economic value, and cultural significance of assets in affected areas, using national census data and expert insights.

The goal is to develop a proprietary algorithm that synthesises this information into accurate risk estimates, informing potential damage scenarios and economic impacts. This innovative and scalable approach accommodates detailed analysis across various territorial extents, whether for large regions or specific property groups such as schools, hospitals, and cultural heritage sites, ensuring that stakeholders have the insights necessary to make informed decisions on asset management and disaster preparedness.


Added Value

VALUESAFE delivers added value through its reliable, expert-certified analyses that standardise vulnerability assessments on a global scale. By integrating diverse data sources, VALUESAFE provides a comprehensive understanding of building vulnerability, saving time and resources while delivering robust, replicable analyses directly applicable to business and regulatory decisions.

Unlike competitors that rely on outdated or non-site-specific data, VALUESAFE utilises advanced satellite data, interferometric analysis, and crowdsourced ground monitoring to produce up-to-date evaluations of multi-risk vulnerabilities across various real estate assets. This unique approach ensures that stakeholders receive the most relevant and timely information for informed decision-making.

Additionally, VALUESAFE’s user-friendly digital platform enhances this value proposition by allowing users to customise analysis targets, detail levels, and outputs to meet their specific needs. This flexibility and responsiveness ensure timely, detailed insights into risk and economic impacts, particularly for municipalities with rich cultural heritage, supporting vital economic development. By focusing on a comprehensive approach, advanced technology integration, and user-centric design, VALUESAFE distinguishes itself in the competitive market for risk assessment solutions. This positions the service as a leader, driving significant progress in climate resilience and sustainable development efforts while enriching the overall customer experience and fostering long-term partnerships.


Current Status

Following the Kick-Off Meeting on 20 September 2024, VALUESAFE activities focused on essential technical aspects, such as reviewing User Requirements and engaging target users. Key topics for requirement collection were defined, and interactions began with potential partners, including public entities and external service providers, to outline necessary qualitative and quantitative parameters.
In the next period, planned activities include finalising and distributing User Requirement forms, collecting detailed feedback to build a reliable statistical base, and selecting specific technical parameters for analysis. This phase aims to ensure a robust framework for aligning user expectations with project goals, enhancing the service offering, and defining a strategic direction for VALUESAFE. The next major milestone is currently planned for 22 November 2024.

SPIRIT

Objectives of the Product

A significant gap exists in current EO data availability. Most infrared imagers in space offer images with a resolution of 60 to 100 meters per pixel, capturing images of specific areas only every two weeks. Our objective is to address this gap by providing high-resolution (~10 meters per pixel) thermal imaging with rapid global coverage. This combination has enormous potential to monitor progress and inform decision-making to combat climate change. By directly measuring heat emissions in the built environment, our frequent high-resolution thermal imaging precisely identifies where and when significant energy inefficiencies occur. This empowers governments, businesses, and individuals to take targeted actions to improve energy efficiency, crucial for transitioning to a net-zero society and meeting sustainability targets.

Additionally, our thermal imaging helps identify heat-stressed zones and indoor overheating during heatwaves, reducing cooling energy demands. Previous services like this were costly due to the need for large telescopes, but recent advancements in telescope technology and the rise of low-cost nanosatellites make our solution affordable and commercially viable as we transition to a net-zero economy.


Customers and their Needs

Our space telescope will help EO satellite operators who want to capture high- resolution thermal infrared satellite images by reducing development costs and enabling large satellite network.


Targeted customer/users countries

Main Locations: UK, Europe and US
Interested and prospective customer companies include: OpenCosmos, Jet Propulsion Laboratory (JPL), Carbon Laces.
Prospective Customers in the Space sector: Planet (USA), Maxar (USA), Airbus (EU), Blacksky (USA), Satellite Vu (UK), ConstellR (Germany).


Product description

We are developing a powerful thermal infra-red (TIR) telescope. It has very high resolution (6.5 metres per pixel), a very large swath (33 km) and it can collect data in a push-broom mode at a very high rate (940,000 square kilometers per hour). Its low unit cost means that large constellations are feasible, which offer daily revisit rates. The customer will buy the product and integrate it into a satellite platform. The satellite will capture EO data which will be sold to the end users.

The product includes an Image Following System (IFS), which removes the blurring caused by the ground motion (~7 km/sec).


Added Value

Our resolution in the TIR band is much better than current or planned offerings. For example, the resolution of LandSat is about 60 m per pixel. SatVu (HotSat) offer a similar resolution to ours, in the MWIR, but they do not offer a large swath, so their data collection rate per satellite is lower..


Current Status

SuperSharp has been developing TIR space telescopes for several years. Part of this development is the use of uncooled micro-bolometer arrays (UMBAs), which are relatively unused for space applications. SuperSharp now has expertise in this area.

The optical design of SPIRIT has been completed. It is innovative because it has a very large field of view (5 degrees), a large aperture (55 cm) and is very compact and lightweight. We have also already started developing an image following system, which enables strip-mapping (push-broom) data collection.

SmartDig

Objectives of the Product

SmartDig, a service based on AI, provides accurate preventive archaeology, a legal requirement for businesses and organisations undertaking construction affecting ground. Detection of surface and sub-surface features helps Cultural Heritage professionals extracting information about potentially buried archaeological remains, reducing waste of time, money due to unplanned delays and avoiding the loss of
valuable historical structures.


Customers and their Needs

The targeted customers for the SmartDig service include professionals involved in public or private construction projects, such as project managers, architects, engineers, and urban planners, who must comply with legal obligations to safeguard Cultural Heritage (CH) and archaeological sites. These stakeholders are involved in various stages of project development, including the design, planning, and execution phases. Their primary need is to ensure that any archaeological features in the area are preserved without causing significant delays or cost overruns to their projects.

Current challenges include the time-consuming process of non-invasive archaeological analysis, which can take up to six months and increase project costs. This delay is due to the extensive retrieval and analysis of photographic and satellite data. Moreover, the complexity of navigating legal frameworks, such as the “Verifica Preventiva dell’Interesse Archeologico” (VPIA), adds further constraints.

SmartDig addresses these challenges by offering a faster, more efficient service for conducting preventive archaeology analyses. By simplifying access to crucial geospatial and archaeological data, SmartDig helps professionals reduce the time and cost associated with the preliminary assessments, enabling smoother project execution while maintaining the integrity of CH sites.


Targeted customer/users countries

The SmartDig service initially targets customers and users in Italy, where legal requirements like “Verifica Preventiva dell’Interesse Archeologico (VPIA)” ensure the protection of Cultural Heritage (CH) during construction projects. However, the service is designed to be adaptable and can be applied across Europe and the rest of the world. It is relevant for any region committed to preserving CH and archaeological features during development activities. Many countries have similar legal frameworks or guidelines for protecting heritage sites, making SmartDig valuable for professionals in public and private sectors globally. The service can assist any country or region seeking to streamline the archaeological assessment process while maintaining a strong commitment to CH preservation.


Product description

SmartDig is an innovative, GIS-based web application designed to streamline preventive archaeology. The tool leverages Artificial Intelligence (AI) and Earth Observation (EO) data to conduct multi-temporal analyses, identifying potential buried archaeological features. This enables SmartDig to detect vegetation, soil moisture, and surface anomalies—such as crop marks, soil moisture marks, and micro-relief—that indicate buried remains.

One of SmartDig’s key innovations is its multi-temporal analysis, which enables users to track seasonal changes and compare data over time, improving the accuracy and reliability of anomaly detection. This system replaces traditional, manual methods, providing results more quickly and consistently while reducing errors. The service offers spot-on-demand analysis or subscription-based access to recurrent analyses, as well as API integration for expert users needing seamless integration with GIS or EO tools.
Users interact with SmartDig through an intuitive web platform. They can upload their Area of Interest (AOI), customise the analysis (e.g., spatial resolution, accuracy), and receive results in an accessible format. SmartDig reduces the time needed for preventive archaeological analysis, offering a more accurate, non-invasive, and cost-effective solution to safeguarding cultural heritage during construction projects.


Added Value

SmartDig brings substantial added value compared to existing competitors by addressing the limitations of traditional preventive archaeology methods. Competitors often rely heavily on manual inspections or high-resolution drone-based imagery, which, while detailed, are costly, time-consuming, and limited in coverage. Drones may provide excellent resolution in small areas but struggle with large-scale projects due to the time and expense required to survey vast regions.
SmartDig, on the other hand, uses AI-driven analysis of Earth Observation (EO) data from satellites, enabling rapid, large-scale, multi-temporal analysis. This approach not only allows for the identification of a wider range of archaeological features, such as crop marks and soil moisture marks, but also minimises the need for costly and slow on-site inspections. Additionally, SmartDig’s ability to analyse historical EO data offers a significant advantage over competitors that rely on real-time data alone, as it can detect changes over time that may indicate hidden features.


Current Status

The SmartDig project is progressing well with several key steps already achieved. We have successfully engaged multiple stakeholders, including archaeologists, researchers, and professionals in the construction industry, to gather in-depth user requirements. This engagement has provided valuable insights into user needs, allowing us to refine the service accordingly.

The preliminary analysis of the best AI architectures is underway, focusing on identifying models that can efficiently process EO data and detect archaeological features with high accuracy. Additionally, preliminary test sites have been selected—some areas with well-known hidden structures and various types of anomalies. These sites will serve as a crucial benchmark for testing the service’s performance.
We have also started assessing the best combinations of EO data for anomaly detection, evaluating different satellite data sources (e.g., LiDAR, SAR, optical) to determine the most effective options for identifying buried archaeological features. These efforts are laying the foundation for further development and testing.

InSARinSub

Objectives of the Product

Information on ground motions is particularly important for the monitoring and management of pipelines and buildings (plus other human-made infrastructures like roads, railroads, tunnels, bridges, metro).

In the first InSARinSub project, new methods for Sentinel radar imagery were developed and utilised for mapping ground motions. This can replace very time-consuming manual surveying.

The satellite-derived ground motion information/mapping was coupled with geological and geotechnical modelling, and hereafter visualised in two GIS web-portals for selected end-users.

In the CCN part of the contract, areas of interest were expanded significantly, and the geological voxel modelling was upgraded even further to include more geophysical and geotechnical parameters.

Also, new end users were included in a more interactive manner, through a continuous dialogue and bilateral meetings, in order to develop useful prototypes and functionalities in GeoAtlas Live.

Our end products are operationally available in GeoAtlas Live, and directly useful to a number of clients within the utility and engineering sectors, or administrative management for governmental/municipal monitoring.

Our end users have the possibility to integrate our products directly into their own systems with API services from Geo and Geopartner.


Customers and their Needs

Key end-user segments including local utility companies, municipal and national authorities have participated in this activity to ensure that product functionality and operationalisation provides optimal value. For instance, in the utility sector there is a constant push for better climate change adaption and better asset management of existing pipeline systems.

Ground deformation affects underground infrastructure in different ways and is of significant interest for utility companies. Instances where ground deformation patterns vary over short distances, water and/or gas pipelines may succumb to the stress and break, while other ground deformation patterns may cause a decrease of the slope of the pipelines leading to malfunctioning of the wastewater systems, among other issues.

A detailed subsurface model can help provide answers to how and why the ground motion occurs, and this can also be used to estimate ground movement, even in areas with poor satellite data coverage. To the utility sector, this directly results in a faster and more robust, agile, and cost-efficient renovation of pipelines.

Road authorities, rail-road authorities, and other authorities at municipal or governmental levels have interest in monitoring existing buildings and existing above-ground infrastructures. Subsidence risk mapping is also equally valid for planning new built-up urban areas, or new infrastructures like roads or bridges.


Targeted customer/users countries

Denmark, Sweden, Germany, Netherlands.


Product description

The developed products include:
• Ground-motion products and functionalities made available for the end users within two specialised web-based tools called GeoAtlas Live and MapGM. The products are targeting utility companies, engineering companies, and authorities of various types as described above.
• The products are disseminated directly through the two platforms, and can also be made available through APIs directly into our users existing GIS systems.

Product 1 example: risk mapping of pipelines in Copenhagen, visualised in the GeoAtlas Live solution
Product 2 example: risk mapping of buildings in Copenhagen, visualised in the GeoAtlas Live solution

Added Value

The InSAR-based calibrated ground-motion products and modelled subsurface/risk analyses are exchanged between the MapGM and GeoAtlas Live platforms.

This synergetic use of ground-motion information and geological data (and modelling) is novel. It also strengthens the models and derived risk products, returning added-value, ground-motion products.

Before InSAR data became readily available, ground-motion maps could not be easily produced with this level of detail or spatial coverage. The recent availability of the Sentinel-based EGMS services (Pan-European) has also lifted the usage and potentials to new levels.

Example of PSInSAR calculation of ground motion at the coastal town of Thyborøn, Denmark.
Screenshot from MapGM visualising derived InSAR layers and subsidence graphs.
Screenshot and overview of our GeoAtlas Live solution, including profile with the of second generation geological voxel modelling for the Copenhagen area.
Determining primary processes using principal component analysis. Example from the Aarhus area.

Current Status

The original project contract was successfully completed in January 2022.

A CCN contract extension/addition was added and carried out from May 2022 to September 2024.

The Final Review meeting of the CCN took place on 1 October 2024.